Usability Test of Personal Antiviruses (July 2012)
Regular antivirus speed testing at our site proved that our users have sustainable interest to how quickly their antivirus products can work and how that effects the computer productivity. That’s why we decided to make one more step and test antivirus usability or ergonomics.
This task was complicated due to two factors: the need to assess subjective users’ preferences and lack of valid and recognized tools for such testing.
Table of Contents:
- Introduction
- Users’ operation speed assessment
- Evaluating the number of users’ errors
- Learnability assessment
- Satisfaction assessment
- Technical aesthetics assessment
- Test results and awards
- Usability summary
Introduction
Our testing experience proves that the methods of evaluating and processing of different productivity data that can be measured objectively cause a lot of different opinions and arguments. And measuring subjective characteristics can arouse even greater number of different opinions.
That’s why we suggest considering this testing not like an absolute evaluation of different products usability but like a touchstone that can give birth to an evidence-based discussion and allow to crate the products usability evaluation methods and tools that would be acknowledged by both experts’ community and ordinary users in IT safety.
The following personal antiviruses took part in the testing (actual versions for the test beginning – June 04, 2012):
- Avast! Internet Security 7 (version 7.0.1426).
- Dr.Web Security Space 7 (version 7.0.0.10140).
- Eset Smart Security 5 (version 5.2.9.12).
- Kaspersky Internet Security 2012 (version 12.0.0.374).
- Norton Internet Security 2012 (version 19.07.2015).
Methodology for Usability Test of Personal Antiviruses »
Test Results and Awards »
Complex usability factor was assessed on the basis of five individual factors including the users’ operation speed, a number of users’ errors, their learnability, satisfaction and technical aesthetics. We’ll discuss the results of five products assessed by these factors.
As a sample to compare the results of all the products, we used and abstract ideal product executing all the operations within the minimum time and not causing any errors due to its “user-friendliness” and “intuitive intelligibility”, including all the possible learning means and implementing self-consistent information model, etc. All the values (in percent) show their differences from this “ideal” product the usability of which was taken for 100%
After we introduced the testing logics, let’s proceed to analyzing the final results.
Users’ operation speed assessment
The quickness of the users’ operations influences the final activity efficiency and satisfaction during our work with antivirus. The less time and operations the user needs to reach his or her goal the higher is the user interface usability.
For the users’ operation speed assessment during the work with personal antivirus, we calculated the time of 10 operations basing on GOMS method. Table 1 shows the time for every operation and every antivirus.
Table 1. Operation time (sec) and number of operations (steps) for every operation
| Operation | Avast | Kaspersky | Norton | Dr.Web | Eset |
| Scanning a separate directory for malwares | 8,8 sec 11 steps |
6,1 sec 8 steps |
12,5 sec 15 steps |
8,6 sec 11 steps |
10 sec 12 steps |
| Launch of all drives and areas scanning | 5 sec 6 steps |
5 sec 6 steps |
5 sec 6 steps |
5 sec 6 steps |
5 sec 6 steps |
| Scanning schedule settings (12:00 every Thursday) | 20,36 sec 26 steps |
27,66 sec 35 steps |
33 sec 42 steps |
35 sec 43 steps |
35,04 sec 46 steps |
| Update launch | 5 sec 6 steps |
5 sec 6 steps |
2,5 sec 3 steps |
7,5 sec 9 steps |
5 sec 6 steps |
| Restoring the file from the Quarantine | 10 sec 12 steps |
10 sec 12 steps |
15 sec 18 steps |
12,3 sec 14 steps |
10,2 sec 12 steps |
| Searching for the Quarantine work information in Help | 10 sec 12 steps |
13,42 sec 15 steps |
15,72 sec 18 steps |
15,64 sec 18 steps |
15,64 sec 18 steps |
| Viewing the last scanning and threats report | 8,9 sec 10 steps |
6,2 sec 7 steps |
8,9 sec 10 steps |
8,5 sec 9 steps |
8,9 sec 10 steps |
| Network screen settings (add Adobe Reader to the trusted applications) | 23,96 sec 30 steps |
16,2 sec 21 steps |
23,9 sec 30 steps |
17,6 sec 21 steps |
40,08 sec 50 steps |
| Adding the application into the scanning exceptions | 12,6 sec 16 steps |
22,7 sec 29 steps |
15,3 sec 19 steps |
17,6 sec 22 steps |
15,1 sec 19 steps |
| Setting the type of reaction to the threat detected | 16,3 sec 20 steps |
11,3 sec 14 steps |
8,8 sec 11 steps |
13,8 sec 17 steps |
14,9 sec 19 steps |
| Total operation time for all the operations, sec | 121 | 124 | 141 | 142 | 160 |
| Final assessment, % | 88 | 87 | 79 | 78 | 69 |
The user spends the minimum time to execute all these operations when working with Avast (121 sec) and Kaspersky (124 sec), a little more time when working with Norton (141 sec) and Dr.Web (142 sec), and the maximum time when working with Eset (160 sec).
Thus, the difference between the minimum and the maximum operation executing time is 39 seconds that is long enough.
Avast and Kaspersky have the minimum execution time for 5 operations and for Norton this factor is three; only one operation takes the minimum time with Dr. Web and Eset.
To give the quantitative assessment for “the users’ operation speed”, let’s compare the time for all the operations for every tested product and “ideal” product (the minimum time for all the operations).
The methodology includes the scheme of final assessment: increasing the time as compared to the “ideal” product by 2 seconds results in reducing the final assessment in 100% by 1%.
In this case, the results for Avast (88%) and Kaspersky (87%) can be considered as excellent, Norton (79%) and Dr.Web (78%) as good, and Eset (69%) satisfactory. The received data is represented in diagram 1.
Diagram 1. Time assessment for executing the antivirus operations by a group of users

The qualitative data analysis shows the biggest time difference in such operations as scheduled scanning settings and adding the trusted applications for the network screen. That’s due to optimization of these operations work a number of products can improve their performance. At the same time, full scanning launch and updates launch takes about the same time in all the antiviruses.
Evaluating the number of users’ errors
Most people prone to attribute errors arising while working with software to bad interface usability without personalizing them. That’s why an “ideal” application must have a user-friendly interface and take into account the user’s perception, attention and thinking peculiarities. In this case a number of errors will tend to zero and the work with this application will be perceived as comfortable.
According to the methodology, while completing the test, users got familiar with the application for an hour and then executed 10 operations the time of which was estimated in the first factor. As the users were working with the application for a limited time, some errors occurred that the more experienced users (working with the tested antiviruses for months and years) would never make.
But we intentionally put the task to model the situation when a user can lack some knowledge and he or she can make mistakes. That allowed to see the user-friendly nature of the interface that is how these applications can help to execute the necessary sequence of operations and protect from trivial users’ errors with their design. The results are represented in tables 2 and 3.
Table 2. A number of errors during executing the operations in antiviruses
| Operations | Kaspersky | Dr.Web | Avast | Eset | Norton |
| Scanning a separate directory for malwares | 4 | 0 | 3 | 1 | 7 |
| Launching full scanning of all the drives and areas | 0 | 0 | 0 | 1 | 2 |
| Scheduled scanning settings (12:00 every Thursday) | 7 | 7 | 5 | 5 | 10 |
| Update launch | 0 | 0 | 4 | 1 | 0 |
| Restoring the file from the Quarantine | 2 | 1 | 1 | 2 | 4 |
| Searching for the information on working with the Quarantine in Help. | 3 | 2 | 1 | 4 | 0 |
| Viewing the last scanning report for the found threats | 2 | 6 | 2 | 3 | 6 |
| Network screen settings (add Adobe Reader to the trusted appliations) | 0 | 1 | 6 | 9 | 5 |
| Adding the application to the scanning exceptions | 3 | 7 | 3 | 3 | 2 |
| Setting the type of reaction to the detected threat | 2 | 2 | 2 | 0 | 1 |
| Total number of errors | 23 | 26 | 27 | 29 | 37 |
Table 3. Types of errors while executing antivirus operations and final assessment
| Operations | Kaspersky | Dr.Web | Avast | Eset | Norton |
| Critical errors | 16 | 20 | 21 | 22 | 28 |
| Uncritical errors | 7 | 6 | 6 | 7 | 9 |
| Final assessment, % | 80,50 | 77,00 | 76,00 | 74,50 | 67,50 |
Users made the least errors while working with Kaspersky (23 errors); a little more mistakes occurred while working with Dr.Web (26 errors), Avast (27 errors) and Eset (29 errors); the most mistakes occurred while working with Norton antivirus (37 errors).
To evaluate the results on this parameter, let’s compare the time for two operations between every product and an “ideal” product (no errors occur while working with it, it has zero errors).
All the errors were divided into two types: critical (the aim is not achieved) and uncritical (motor errors, misprints, misreading the values of the indicators, wrong operating procedure that still resulted in the correct operation).
The methodology includes the scheme for the final result calculation: reduction by 1% for every critical error and 0.5% for every uncritical error from the source value of 100%. In this respect Kaspersky has excellent results (81%), Dr.Web (77%), Avast (76%) and Eset (75%) have good results and Norton (68%) showed unsatisfactory results. The data obtained is represented in diagram 2.
Diagram 2. Evaluating the number of users’ errors while working with antiviruses

The qualitative analysis of the received data proves that the most errors occurred while setting the scheduled scanning. And that’s the point where general tendencies stop.
For example, the most errors with Dr.Web occurred while searching for the report viewing tool (lack of centralized report viewing tool disoriented the users) and adding an application to the exceptions.
The problems with Avast and Eset occurred when adding applications to the trusted list for the network screen. The most errors with Norton occur when performing selective scanning of a definite directory and report viewing. Optimizing these operations can reduce the number of users’ errors.
At the same time, a number of operations didn’t arise any errors: full scanning launch, update launch, restoring the file from the Quarantine, Help search, setting the reaction type for the found threats.
Learnability assessment
The users’ learnability in our methodology is assessed by the learning means range and quality and the program information model consistency. The learnability shows how quickly a user can learn to work with the product and apply this software for its intended purpose. On the other hand, with the application miscomprehension the user is more inclined to criticize the application design than to estimate his or her own assiduity and learning ability.
According to the methodology, this factor was assessed on the basis of experts’ evaluations they made while working with the questioners after they got familiar with the products. The experts’ assessment of the users’ learnability is provided in table 4.
Table 4. Users’ learnability assessment, %
| Antivirus | Learning materials | Information model | Final assessment |
| Eset | 96 | 91 | 93 |
| Kaspersky | 90 | 86 | 88 |
| Norton | 82 | 84 | 82 |
| Avast | 86 | 78 | 82 |
| Dr.Web | 81 | 79 | 80 |
All antiviruses got excellent grades for the learnability. Eset received about maximum grades (93%) and Kaspersky received a little less (88%). Norton (83%), Avast (82%) and Dr.Web (80%) tail this group.
Thus, we can say that all the testing antivirus vendors pay great attention to their users learning and their products intelligibility. The final results on learnability for all the products are presented in diagram 3.
Diagram 3. Learnability assessment

Let’s discuss the grades structure and what minuses were found.
Most antiviruses except for Norton include control elements without any context help or description by them. Most antiviruses except for Kaspersky also have some problems in documentation and their solution methods described too briefly or not described at all. Full-fledged interactive materials (such as video lessons on antivirus software) can be found at the official Kaspersky and Eset websites and you can’t find any for the other products. Lack of local help for Norton can also arise some discomfort for the users.
There’s no end-to-end model for Avast and Norton, that is there’s no unified user interface, settings and documentation design. In this case, the user has difficulties when searching for the settings and component description used in the interface. Dr.Web and Kaspersky have this end-to-end model but there’s some difference in the protection components structure in the user’s interface and settings.
You can find duplication of work with the parent control from the main application window and settings for Kaspersky. At the same time, this application allows to launch two settings windows for the parent control simultaneously. Kaspersky and Avast have windows for information only. These are “Cloud protection technology” for Kaspersky and AutoSandbox for Avast. Such windows may cause misunderstanding of application logics and negative emotions as the user expects he can execute some operations in these windows but in fact he can’t.
Avast and Dr.Web have no centralized tools for working with reports and settings. As the result, users have to switch between several windows and sections. Scanning duration prognosis is also reflected incorrectly or not presented at all in Dr.Web and Norton.
Users’ satisfaction assessment
Satisfaction shows directly how comfortable the user felt when working with the product. This parameter is mostly fixed to find different minor factors that are difficult to formalize and measure but that influence the software user-friendliness. For example, the unified design of the user interface, the objects distracting the users’ attention during long wait, etc.
The satisfaction rate for applications can be evaluated after you ask one question: did you feel comfortable when working with the software? But for better differentiation of this factor, we used a number of questions to assess different antivirus components: the users had to give their own grades by several factors. In this case an “ideal” product had to get the highest grades for every question and the difference between the users’ and the maximum grades reduced the final grade for every tested antivirus. The changes in satisfaction are reflected in diagram 4.
Diagram 4. Users’ satisfaction assessment, %

Kaspersky antivirus showed the best results for this factor (88%) and one third of users gave the highest grade for this product (100%). The users emphasized user-friendliness of the interface both as a whole and when executing different operations. Eset (78%), Avast (72%) and Norton (70%) also showed good results. Dr.Web (52%) got the lowest grade.
Open question analysis showed that low grades mostly relate to the user interface structure that is not familiar for many users. There’s no main application window at Dr.Web and all the operations for this software are executed through the context menu appearing after you click an icon in system tray.
Technical aesthetics assessment
Most interface usability researches are limited to evaluating some or all the above mentioned parameters. But in this case the interface assessment turns out to be just indirect and the interface attractive appearance is not evaluated at all.
According to the methodology, the visual attractiveness as evaluated by two ways: by questioning the users after they worked with the product (subjective grade) and by experts’ analyzing the GOST requirements for usability (objective grade). GOSTs provided established and verified criteria for working with application windows. The obtained results are provided in table 5.
Table 5. Technical aesthetics assessment for antiviruses, %
| Antivirus | Users | Experts | Final grade |
| Eset | 80 | 94 | 87 |
| Kaspersky | 85 | 83 | 84 |
| Avast | 77 | 91 | 84 |
| Norton | 72 | 90 | 81 |
| Dr.Web | 62 | 79 | 70 |
Eset (87%), Kaspersky (84%), Avast (84%) and Norton (81%) got excellent grades for technical aesthetics, а Dr.Web (70%) got a good grade.
It proves that all the tested antivirus vendors pay great attention to visual attractiveness of the user interface.
The final technical aesthetics grade for all the products are provided in diagram 5.
Diagram 5. Antivirus technical aesthetics assessment

Let’s discuss the problems discovered during the antivirus technical aesthetics assessment.
For normal text box reading, the recommended contrast between the text box and the background is 3:1 and the tolerable contrast is 6:1. Dr.Web has text boxes with the contrast that is less than 6:1, and in Avast, Kaspersky and Norton it’s under 3:1. With the screen resolution of 1920*1080, all antiviruses except for Dr.Web have text boxes with the font size of less than affordable values (17 amin or 2.33 mm with the distance of 40 cm from the screen).
All the antivirus applications except for Norton have some violations in the software elements style, i.e. we see either software elements in different style or simultaneous presence of stylized and standard elements. For example, “Network monitoring” window in Kaspersky uses standard tabs and the Quarantine and storage use stylized tabs.
Dr.Web, Kaspersky and Norton have small application elements (less than the cursor size) that makes working with them too difficult. Dr.Web and Kaspersky also use pictograms that have no inscriptions that makes understanding them difficult.
While evaluating the users’ answers, we can specify the aspects that they liked the least.
- According to the users, Dr.Web has the worst font readability and Dr.Web and Norton have the works pictogram intelligibility.
- The users also pointed to the Norton’s interface overloaded with information and control elements. With Avast antivirus, the users gave bad grade to the logic and control elements grouping.
- At the same time, the users of all antiviruses gave a high grade to the color design harmony and text readability (except for Dr.Web).
Test Results and Awards
On the basis of the users’ grades for every characteristic, we calculated the final usability value. According to the methodology, the final grade was calculated with consideration of all the recognized rates. The results are provided in table 6 and diagram 6.
Table 6. General usability assessment for personal antiviruses, %
| Antivirus | Operations speed | Lack of errors | Learnability | Satisfaction | Technical aesthetics | usability |
| Kaspersky | 87,09 | 80,5 | 87,8 | 88,1 | 84,1 | 85,7 |
| Eset | 68,95 | 74,5 | 93,4 | 77,5 | 86,9 | 81,3 |
| Avast | 88,42 | 76,0 | 82,2 | 71,9 | 83,9 | 80,1 |
| Norton | 78,57 | 67,5 | 82,8 | 70,2 | 80,9 | 76,2 |
| Dr.Web | 78,11 | 77,0 | 80,0 | 52,1 | 70,2 | 69,8 |
Diagram 6. General usability assessment for personal antiviruses
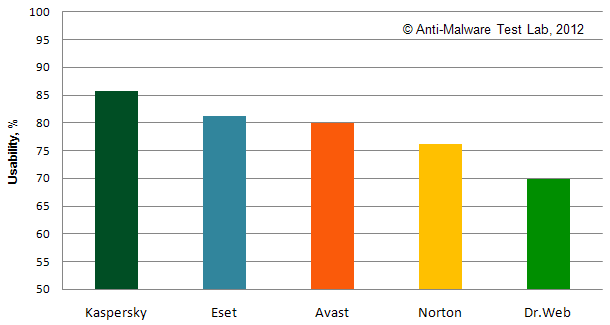
Kaspersky Inernet Security (86%) is recognized the best in usability with Eset Smar Security (81%) and Avast Internet Security (80%) following it. According to the award procedure, all these antiviruses receive Gold Usability Award. Norton Internet Security (76%) takes the fourth place and Dr.Web Security Space (70%) tails this list. These two products receive Silver Usability Award.
Kaspersky antivirus turned out to be the best in satisfaction and minimum work errors, Eset received the maximum in learnability and technical aesthetics and Avast showed the shortest users’ working time.
The obtained results prove that personal antivirus vendors pay great attention to the interface usability. There were no obvious failures for all the factors among the tested antiviruses; we’re like to to attribute the only low rate of satisfaction for Dr.Web to the “template break” with the users that got accustomed to the work made through the main window.
Table 7. Final results of usability testing (usability) of personal antiviruses
| Antivirus | Usability | Award |
| Kaspersky | 86% |
Gold Usability Award |
| Eset | 81% | |
| Avast | 80% | |
| Norton | 76% |
Silver Usability Award |
| Dr.Web | 70% |
Usability summary
As a data bulk was obtained for every antivirus, we’d like to provide generalized grades for every characteristic in spider charts for better understanding of the results (diagram 7-11).
Diagram 7. Generalized results for usability values for Kaspersky Internet Security 2012
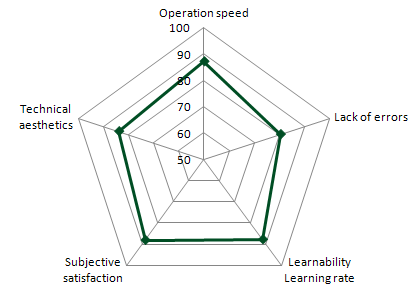
Diagram 8. Generalized results for usability values for Eset Smart Security 5
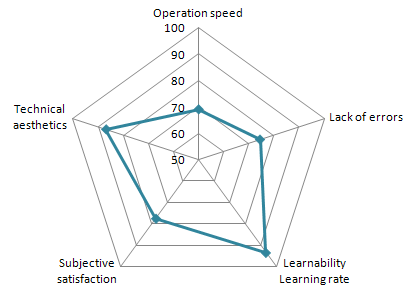
Diagram 9. Generalized results for usability values for Avast! Internet Security 7
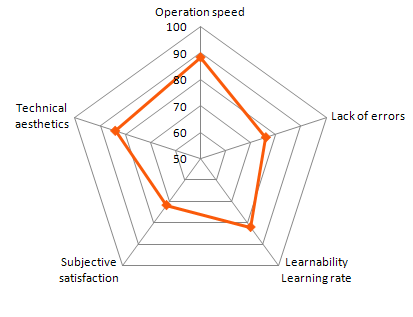
Diagram 10. Generalized results for usability values for Norton Internet Security 2012
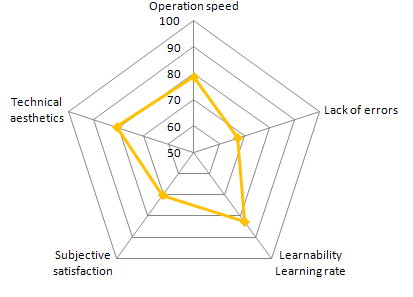
Diagram 11. Generalized results for usability values for Dr.Web Security Space 7
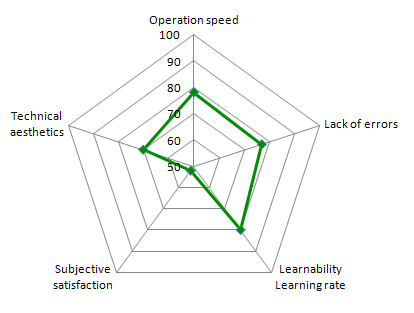
Ilya Shabanov, managing partner of Anti-Malware.ru:
There’s a popular belief among experts that interface isn’t so important for a personal antivirus. But the users’ experience of working with the products is formed under the influence of antivirus usability and visual attraction of interface. That’s why we dared to perform complex testing of antivirus usability. And we were the first to do that in our industry!
“That’s interface and its usability that form subjective impression of the product and influence the users’ satisfaction to a great degree. Subjective and emotional components often become the key ones in the product evaluation. In negative cases, that can be the cause to refuse from using an antivirus despite its good computer protection. Our testing results demonstrate which antivirus interfaces are attractive and comfortable for user and which can disappoint them.”
Our test results show which antivirus' interfaces are the most convenient for users and which are not.
Mikhail Kartavenko, manager of testing laboratory of Anti-Malware.ru:
“This testing took a year of work most part of which consisted in formulating the methodology for the antivirus complex analysis and creating adequate tools for this task. The task was difficult as the tests of this type are mostly based on the senses of one person’s own self and only two research laboratories can perform such testing on the scientific basis. But they understand usability just as the users’ work speed and the fact of false antivirus response.
But we wanted to receive the complex usability assessment that would take into consideration different aspects of the users’ interaction with interface. And to my mind, the test achieved this aim. We hope some vendor will take the testing results into account and that will help to improve the antivirus products application.
I’d like to emphasize that this test is the first test of such kind and we’ll be happy to hear all kind of positive criticism and all suggestions that can help us to improve the obtained results validity and reliability.”
- Login to post comments

